

Skip to content
eduscope

Search

Search for schools, places and postcodes

eduscope

What the numbers say

Short stories from official school data, in plain English. Where results are rising, where children miss the most school, and what it means for your family.

  • Official DfE and Ofsted data
  • Every number compared with England
  • Free to read
Pupils with hands raised while their teacher stands at the whiteboard
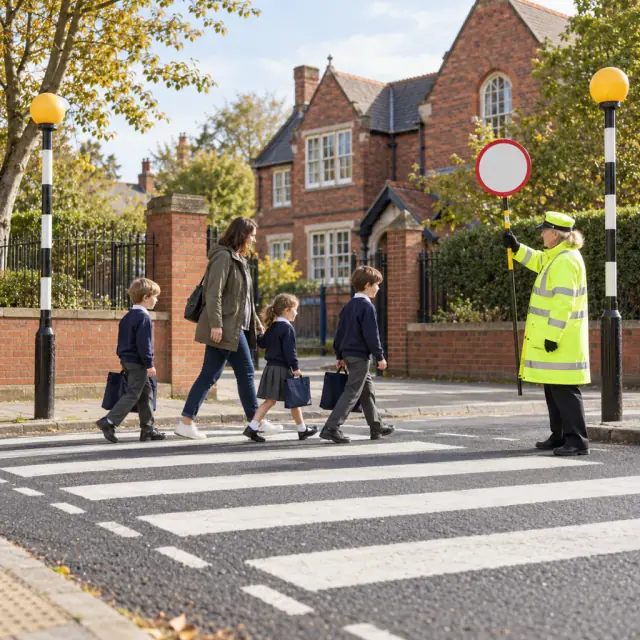
A school crossing patrol helping children across a zebra crossing
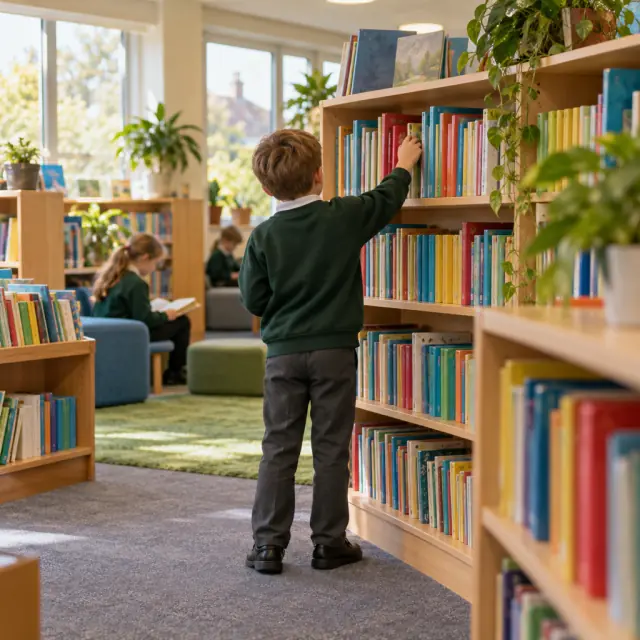
A primary pupil reading a picture book on a beanbag in the school library
13 for 10First choices for every 10 places
All insights

Stories from the data

Each story looks at every local authority in England, then explains what the gap means if you're choosing a school.

Showing 1 story about admissions

How we write these

Three rules for every story

We're not here to rank schools or scare anyone. We look for the patterns that help parents ask better questions.

  • Official data onlyDfE statistics, Ofsted outcomes and school census figures, with the source and year under every chart.
  • Every number comparedA figure on its own means little. We always show the local authority and England alongside it.
  • Plain English, then what it means for youEach story ends with practical points for parents, not just a ranking.
A sixth-former studying with a laptop and folders in a common room
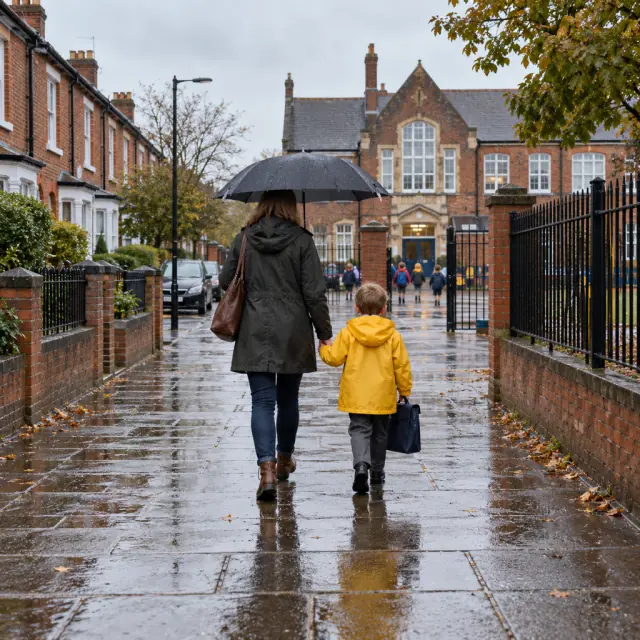
A parent with an umbrella walking a child in a yellow raincoat to school

53,000+schools in England behind these stories

Search

Search for schools, locations, and postcodes